S.A.T - School Assessment Tool
This is the main assessment tool of the project and it aims at evaluating the situation of our schools before and after the project fulfillment.
It provides 168 descriptive Indicators. Each coordinator will be in charge of transferring the Project contents and tasks to the school-staff/team involved. Moreover he/she will monitor the fulfillment of the planned activities.
SAT-School Assessment Tool is the main Intellectual Output. This tool will help us to be challenged (as teachers) and to reconsider our opinions, especially through the interaction with partners.
The SAT offers14 Elements of Analysis measured through 3 different stages revealing the school situation aganist Project targets. This 3 stages (3 separate columns) are named Developing, Building, Sustaining and each stage presents 4 Descriptive-Indicators to evaluate each Element of Analysis. We suggest to download the SAT from the link below for a better understadning of this tool.

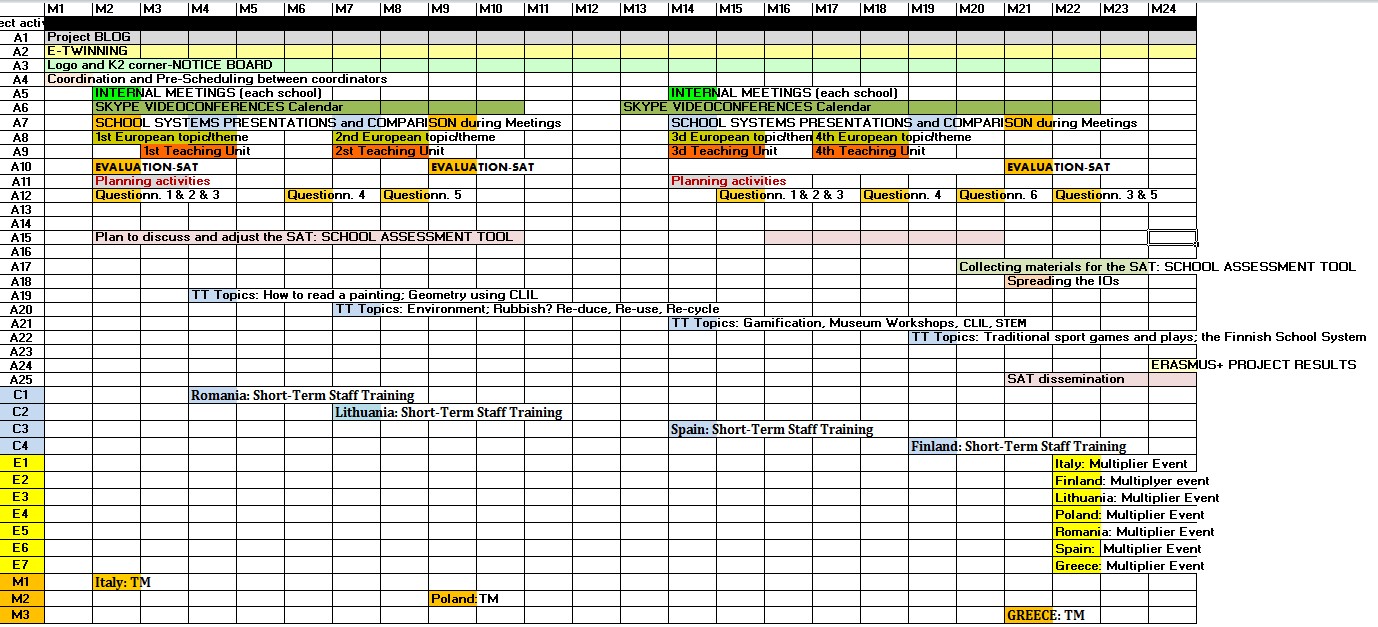
GANTT CHART TIMELINE
It is an order of events or actions placed along a bar where time periods are labeled. It is a good way to visualize all tasks and events that have start and end dates.
A Gantt chart is one of the easiest and most popular ways to visualize events along a timeline. It clearly shows which tasks are already finished, which ones are in progress or lay ahead. Timelines also show tasks dependencies and any delays in a project.
To make a timeline in a Gantt chart, one needs to know all tasks, dependencies, durations, and deadlines.
Skill Evaluation Sheets-Samples (Italian School)
Compito Autentico (Experience-based task)

Competenze sociali e civiche / imparare ad imparare
(Social & Civic Skills / Learning to Learn)

Griglia di Valutazione per Compiti Autentici
(Evaluation Matrix for Experience-based Tasks)

Article in progress.....
https://drive.google.com/open?id=1huTU2GYEsWaoAaMGn3UFp1xxPfo8C0Ld
No comments:
Post a Comment
Note: only a member of this blog may post a comment.